We’ve been working on a feature to help newsrooms figure out how to evaluate and pay their staff more efficiently, week-in, week-out. Here’s why.
Save time
Every fortnight, writers at the Kansas State Collegian fill out their pay sheets so they can show their editors what they worked on. On average, let’s say it takes just 2 minutes for each writer to fill one of these pay sheets out. Each desk editor then checks their writers’ sheets to make sure they’re accurate. On average, this takes each desk editor 10 minutes to do. The person who’s responsible for collecting all these pay sheets then needs to enter each person’s details into a spreadsheet, so it can go into the billing system. This takes them about an hour each fortnight.
Here’s what that means.
30 writers write articles over a two-week period, so 30 people spend 2 minutes each writing their pay sheet (60 minutes in total). Four desk editors take 10 minutes each to check these writer sheets (40 minutes in total). Then an editor needs to summarize the pay sheets so they can be added to the billing system (60 minutes in total).
Total time spent every two weeks = 2 hours, 40 minutes
Total time spent every 10 week semester = 13 hours, 20 minutes
In this case, our goal is to save the newsroom over twelve hours a semester in tracking whom they should pay and how much. In comparison, a newsroom like The Daily Wildcat at the University of Arizona has seven desk editors that spend about 30 minutes each counting their writers’ bylines. That’s a total of over four hours of time that Camayak could save them, every fortnight.
Save money
At Georgia Southern’s Student Media department, the students are paid through a bi-weekly stipend. Even though they spend less time tracking how many assignments each writer has worked on each week, they can sometimes lose track of a writer falling short of their weekly commitment.
A writer stops writing regularly and therefore no longer qualifies for she fortnightly stipend. Since the writer hasn’t officially informed their editors that they’re quitting, payroll doesn’t know that they shouldn’t be paid this week.
In this case, Camayak can now save the newsroom from over-paying its contributors, to ensure that it never spends more money than it has to.
Analyzing staff performance with visualizations
We exported payroll data for a couple of newsrooms that use Camayak and using the RAW visualization tool, turned their statistics into pretty pictures.
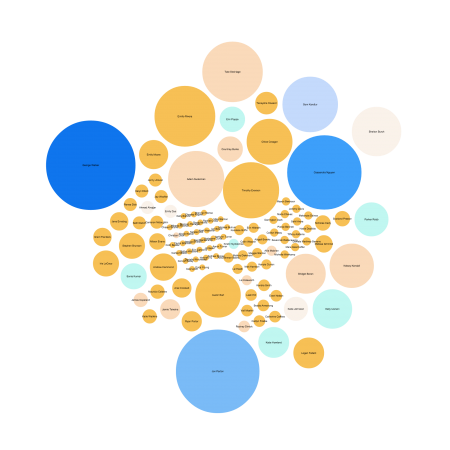
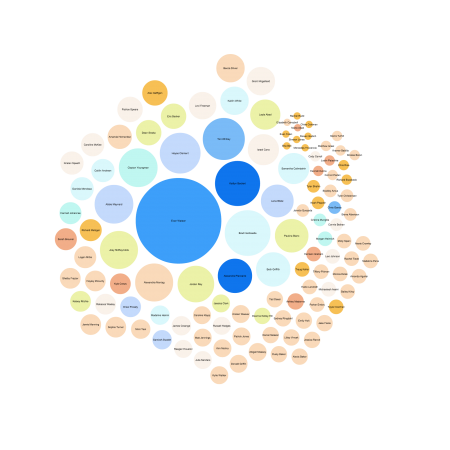
The size of the circles refers to how many assignments each staff member completed and/or uploaded files to, between July 2014 and February 2015. The larger the circle, the more assignments they worked on. The colors of the circles reference how many files each staff member uploaded to those assignments. The closer to orange, the fewer files they uploaded. The closer to blue, the more they did.
Kansas State Collegian
113 staff wrote and/or uploaded files to approved assignments from July 2014 to February 2015.
Largest circle: 236 assignments
Darkest blue: 221 file uploads
Darkest orange: 0 files uploaded
TCU 360
113 staff wrote and/or uploaded files to approved assignments from July 2014 to February 2015.
Largest circle: 137 assignments
Darkest blue: 215 file uploads
Darkest orange: 0 files uploaded

